
2022 NORTHWEST CHERRY CROP STATISTICAL OVERVIEW
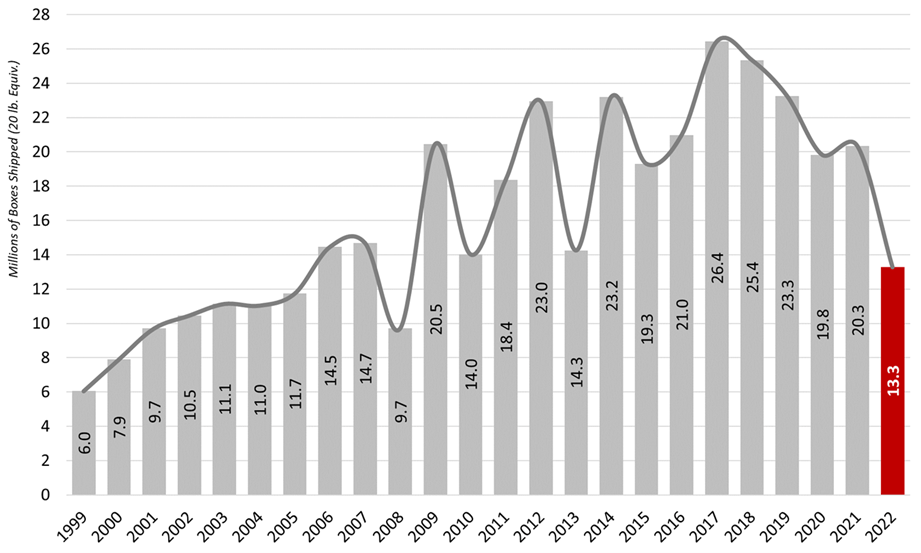
The 2022 Northwest Cherry Season will be remembered as the shortest crop of the past 15 years. The 2022 crop was negatively affected by an April snowstorm on top of bloom that was followed by several significant rain events that left our growers with what could be best described as “half a crop”. The final crop volume number for 2022 was 13,277,332 20 lb. equivalent boxes.
The 2022 season was negatively affected by six inches of snow that fell across the 5-State region on April 14, 2022. The late snowstorm crashed what was shaping up to be a fairly typical harvest – as the crop was 60% in bloom when the snow struck across our 5-State region. Growers had never seen so much snow so late in the growing season. By mid-May it was clear that the bloom that was hit by snow did not pollinate at a level we had hoped. From there, the short crop that followed was a challenge of high wholesale and retail prices that were as much as 60% higher than grapes, strawberries, and blueberries.
Globally, the world market continues to show repercussions relative to both COVID and the ongoing U.S. trade war with China. Over the past several years, the Northwest cherry industry has had to deal with 40 to 60% tariffs on fruit shipped into China – which was our number one export market in 2017 when we shipped just over 3 million 20 lb. equivalent boxes. Market intelligence tells us that it might take years for China to rebound to the level of volume we saw in 2017. Our reality is that between ongoing COVID issues, a weakening political and business relationship, and the strength of the U.S. dollar, we will be lucky to ship upwards to 1 million boxes to China in 2023.
From a horticultural standpoint, the number one issue facing Northwest sweet cherry producers continues to be the ongoing battle against “Little Cherry Disease”. Growers in all five states are seeing this strain of tree killing disease creep into their orchards. The industry is now on full alert with the scientific community putting together a task force to help identify and develop a sustainable plan to eradicate the malady. As the battle for healthy orchards has carried into the new year – the Northwest Cherry Growers will continue to battle for new markets and increased shelf space around the globe.
The 2022 Northwest cherry harvest was the shortest crop since 2008, which was a very short crop that came in at a mere 9.7 million 20 lb. equivalent boxes. If you add in the short California crop – the Pacific Coast crop came in at 18 million 20 lb. equivalent boxes. The 2022 season ran from June 8th to September 11th, a total of 92 days of shipments.
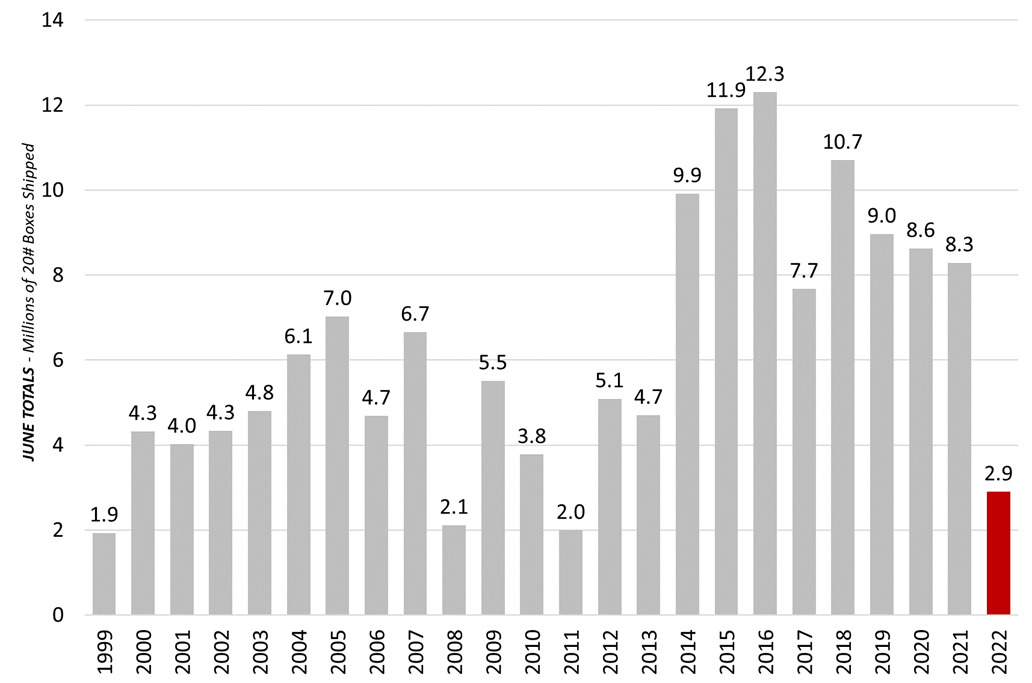
The peak shipping day in 2022 was July 22nd – where 376,358 boxes were shipped. It is important to note that historically, the industry’s largest shipping days usually fall between 600,000 and 700,000 boxes. The Northwest industry shipped 2.9 million boxes in June (compared to 8.3 million boxes in June of 2021) which left the North American retail trade without enough cherries to cover the ever-important 4th of July promotions. In fact, overall ad activity over the 4th of July was down 49% from 2021; while price was up by 72% during that same window.
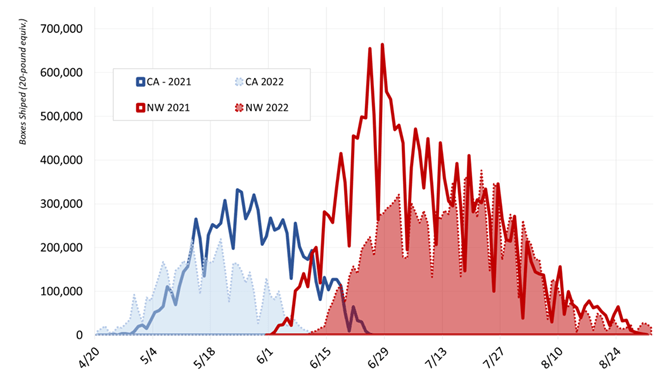
Adjacent is a chart that shows both Northwest and California shipments by day over the past two years:
2022 Northwest Cherry Season Key Statistics:
The industry shipped for 92 days in 2022. The first shipments left the industry on June 8th and the last box shipped on September 11th. In comparison, we shipped for 92 days in 2021, 94 days in 2020, 90 days in 2019 and 2018, 86 days in 2017, and 87 days in 2016.
- As always, the brunt of the crop was shipped in 60 days from mid-June to mid-August.
- The industry shipped 2.86 million 20 lb. boxes in June.
- The industry shipped 8.16 million boxes in July 2022.
- On July 22nd, the industry shipped 376,358 boxes which was the 2022 peak shipping day.
- The second largest shipment day was July 18th – 359,989
- The industry averaged over 269,816 per day from July 1st to July 20th. Comparatively, we averaged 356,083 boxes per day from July 1st to July 20th in 2021.
- The industry averaged 144,319 boxes per day during the 92 days of the 2022 season.
- The Rainier cherry pack was 1.14 million 15 lb. equivalent boxes.
- The crop shipped was 77% domestic and 23% export in 2022.
- California started shipping cherries on April 26th and finished shipping on June 10th. In total, CA shipped a crop of 5.2 million 18 lb. equivalent boxes in 2022. The California sweet cherry industry and the Northwest overlapped for 25 days in 2021.
There were a mere 1 million boxes of overlap shipments between both the NW and CA in 2022. There was a total of 2 days of shipment overlap this past season.
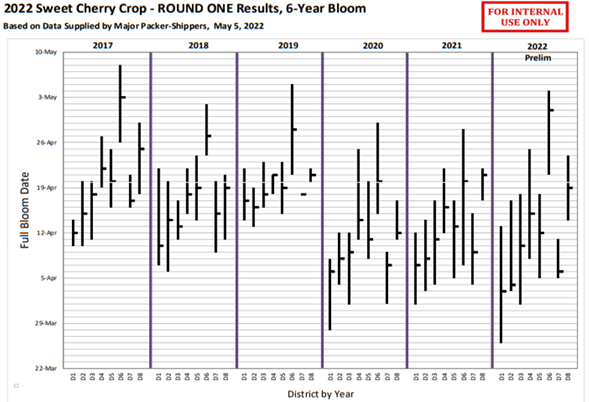
Bloom Timing: Northwest is hit by snow on top of bloom in mid-April 2022
I think we can all agree that we would like to see the current La Niña weather pattern that has brought extreme heat in 2021 and extreme cold in 2022 switch to a more moderate El Niño weather pattern. The bad news is that it appears the industry will have to operate through yet another La Niña weather pattern in 2023. The 2022 weather can be summed up with a couple of outlier occurrences that came along with the snow and rain we saw in April, May, June, and early July. The Northwest saw the 3rd coldest April on record; which was followed by the wettest May and June window since 1948.
We saw extreme rain events in early June and over the 4th of July weekend in 2022. It is estimated that rain was responsible for the industry losing close to 2 million boxes this past year. Throughout the spring, cumulative growing degree day build up was a bit behind normal but as the spring materialized, it was clear that the early districts and late districts were well separated by degree days.
The bloom for 2022 was definitely spread out and the districts showed the separation across the season as there were periods where the industry was so short on fruit that only a few domestic retailers could get our fruit. As the spring continued to remain cool the start of the season was pushed back all the way until June 8th. As always, the late start and lack of volume in June had a negative affect on Northwest Cherry ad programs where the ads needed to drive sales never materialized and average pricing of over $6.99 per pound further staunched purchases of our fruit.
1999 to 2021 Historical June Shipments in Millions of Boxes
Adjacent is a chart showing the past 23 years of June shipments. As you can see, we saw the 4th shortest June crop since the turn of the century. The first recorded shipments left the industry on June 8th. The California crop shipped until June 10th.
July Kicked off with Three Days of Rain over the 4th of July Holiday
The industry finally started to get some momentum as volume ramped up over the last week of June. Unfortunately, the rain that was persistent in early June returned to the region and many production areas saw several days of steady rain as the month of July got under way. As mentioned, the Northwest saw the most rainfall since 1948 during the May and June window. The rains over the 4th of July caused more production slowdowns and left the industry with even less fruit to bring to market during a critical harvest window. The good news is that as we forged through July the weather remained dry and during the week of July 25th, the industry saw the most aggressive promotion activity of the season; which helped move our fruit through the retail system and created a demand exceeds supply scenario for the back end of the season.
As we have seen regularly over the past decade, July was our single largest shipping month in 2022. As the adjacent chart depicts, we saw 8.2 million 20 lb. equivalent boxes shipped in July this year.
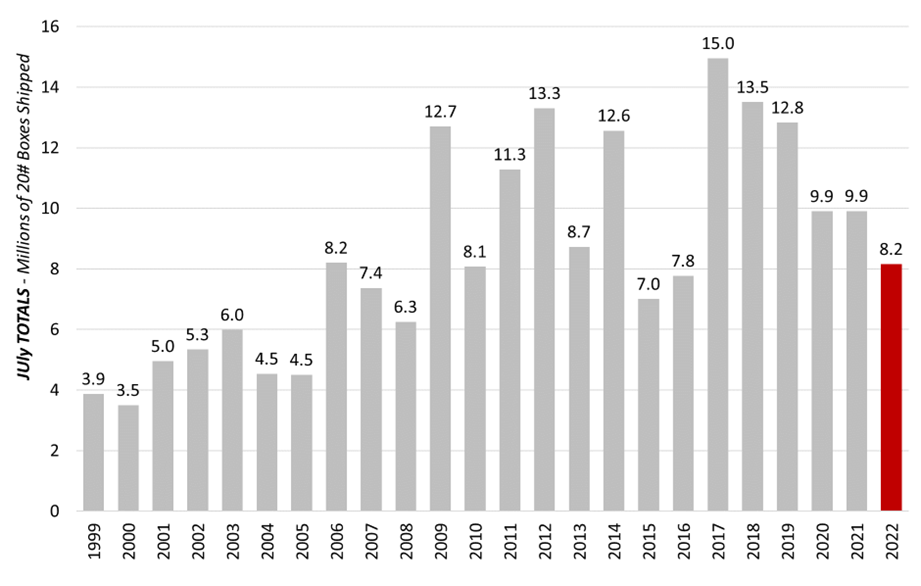
To successfully get through July, the industry needs to have a mix of quality fruit, consumer demand, and momentum carried over from June fruit sales. The lowest promoted prices of the year occurred during the week of July 25th. The domestic market showed retails averaging $3.98. Prior to that week the average ad pricing generally stayed above $5 per pound. The good news is that during the week of July 25th, the lowest best promotion week by price of the season drove retail sales and demand exceeded supply for the remainder of the year. .
Late Start Leads to a Robust August Despite Short Crop
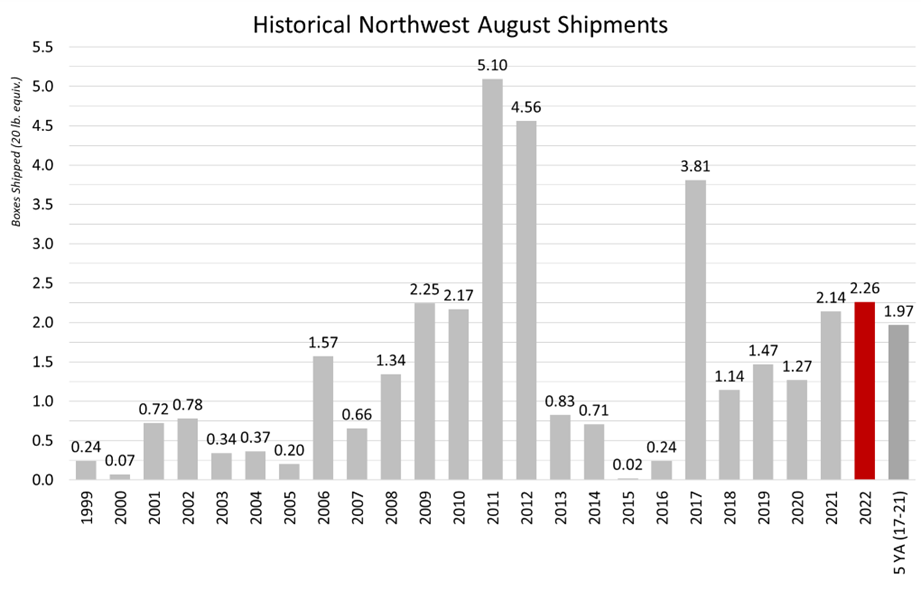
In 2022 our late harvest orchards were a bit later than we have seen in recent years. Again, the last shipments left the industry on September 11th … which is a testament to the later crop we saw this past year. Likewise, it remains relevant to note that the industry consistently shipped almost 4 million boxes after July 25th during the years 2011 to 2012. Likewise, this phenomenon remains an annual opportunity for retailers and importers to maximize sweet cherry category sales almost to September. The 2022 season saw a total of 2.26 million 20 lb. equivalent boxes shipped in August.
Late maturing varieties continue to see acreage expand throughout the Northwest region. Currently, there is an abundance of high density/high elevation plantings of late harvest varieties like Sweetheart, Glory, and Staccato that allow for shipments to last into September.
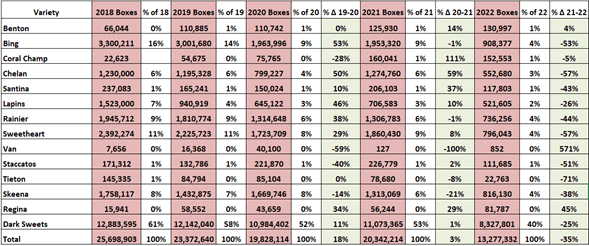
The Varieties: Bing Remains Northwest’s Largest Volume Variety
As always, our industry certificates of compliance were heavy to “dark sweets” in 2022. The variety designation “dark sweets” accounted for over 40% of the crop. Each year, more retailers are requesting a box label/stamp that simply states “dark sweets” or “sweet cherries” with no mention of specific variety. We set a light crop on all varieties in 2022… Bing our single most prevalent variety came out to a known total of 908,337 20 lb. equivalent boxes which constituted 4% of the total crop. We have lost Bing volume to both little cherry disease and growers planting varieties that have potential for more tonnage per acre than Bing traditionally offers.
This year the variety Skeena ended up being the second largest variety by volume; the industry shipped 816,130 boxes. This year the Northwest industry shipped 796,043 boxes of Sweethearts (3.8% of the crop) which was the third most prevalent variety. Of note, a couple of varieties jumped in volume this past year. Newer varieties like Coral Champagne and Black Pearl emerged as the varieties that saw the most volume growth in 2022.
For an overall look at volume by variety over the last 5 years, please refer to the adjacent Volume by Variety chart:
Yellow Variety Cherries Hit Hard by Wind and Rain in 2022
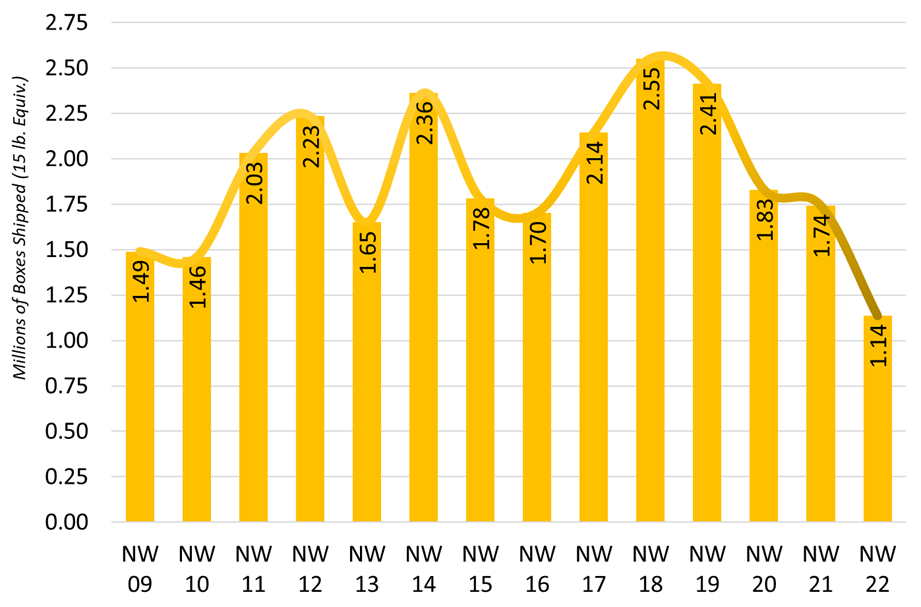
Again in 2022, early season wind and rain affected the front end of the Northwest yellow cherry crop. The 2022 Rainier or yellow cherry harvest produced what is best described as the “shortest crop in the past 15 years” which came in at 1.14 million 15 lb. equivalent boxes. Yellow cherries accounted for 16% of all cherries exported in 2022. Leading export markets in terms of volume were Canada, China, Japan, and Taiwan, respectively.
The yellow cherry crop saw reasonable demand from beginning to end of the season. On the right is a chart that shows how the yellow cherry crop shipped in 15 lb. equivalents over the last decade. Despite the short crop in 2022, the industry increased its Rainier volume by 185% during that time.
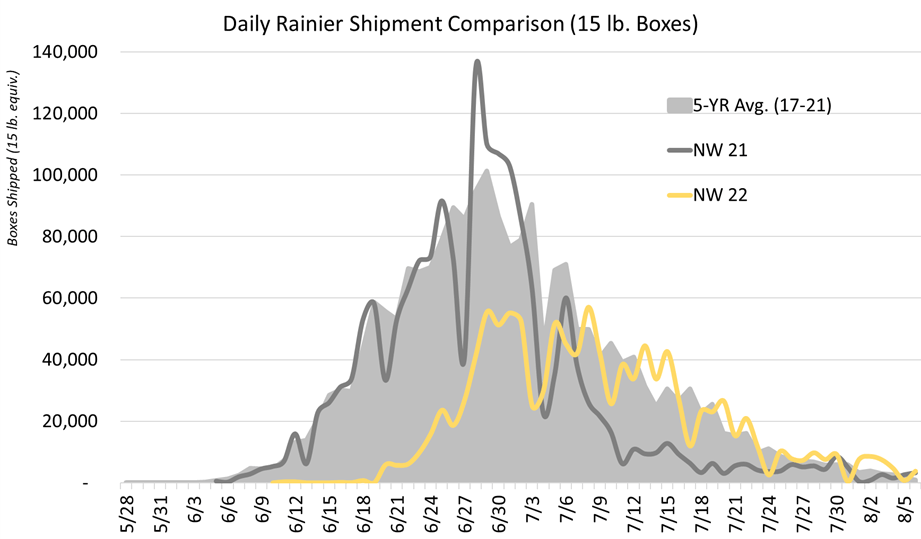
The chart below depicts shipments of yellow varieties in the 2022 crop compared to 2021 and the 5‐year average.
If you are a retailer, it is important to note that there is an important trend occurring in what is a new “early” variety of Rainier. This variety is called the “Early Robin” and while it is indiscernible from a traditional Rainier, it is picked a full week ahead of the traditional Rainier variety and has almost identical qualities
Organic Sweet Cherry Production in Washington State
For the tree fruit industry and sweet cherries, the organic sector will continue to be a key piece of our future business.
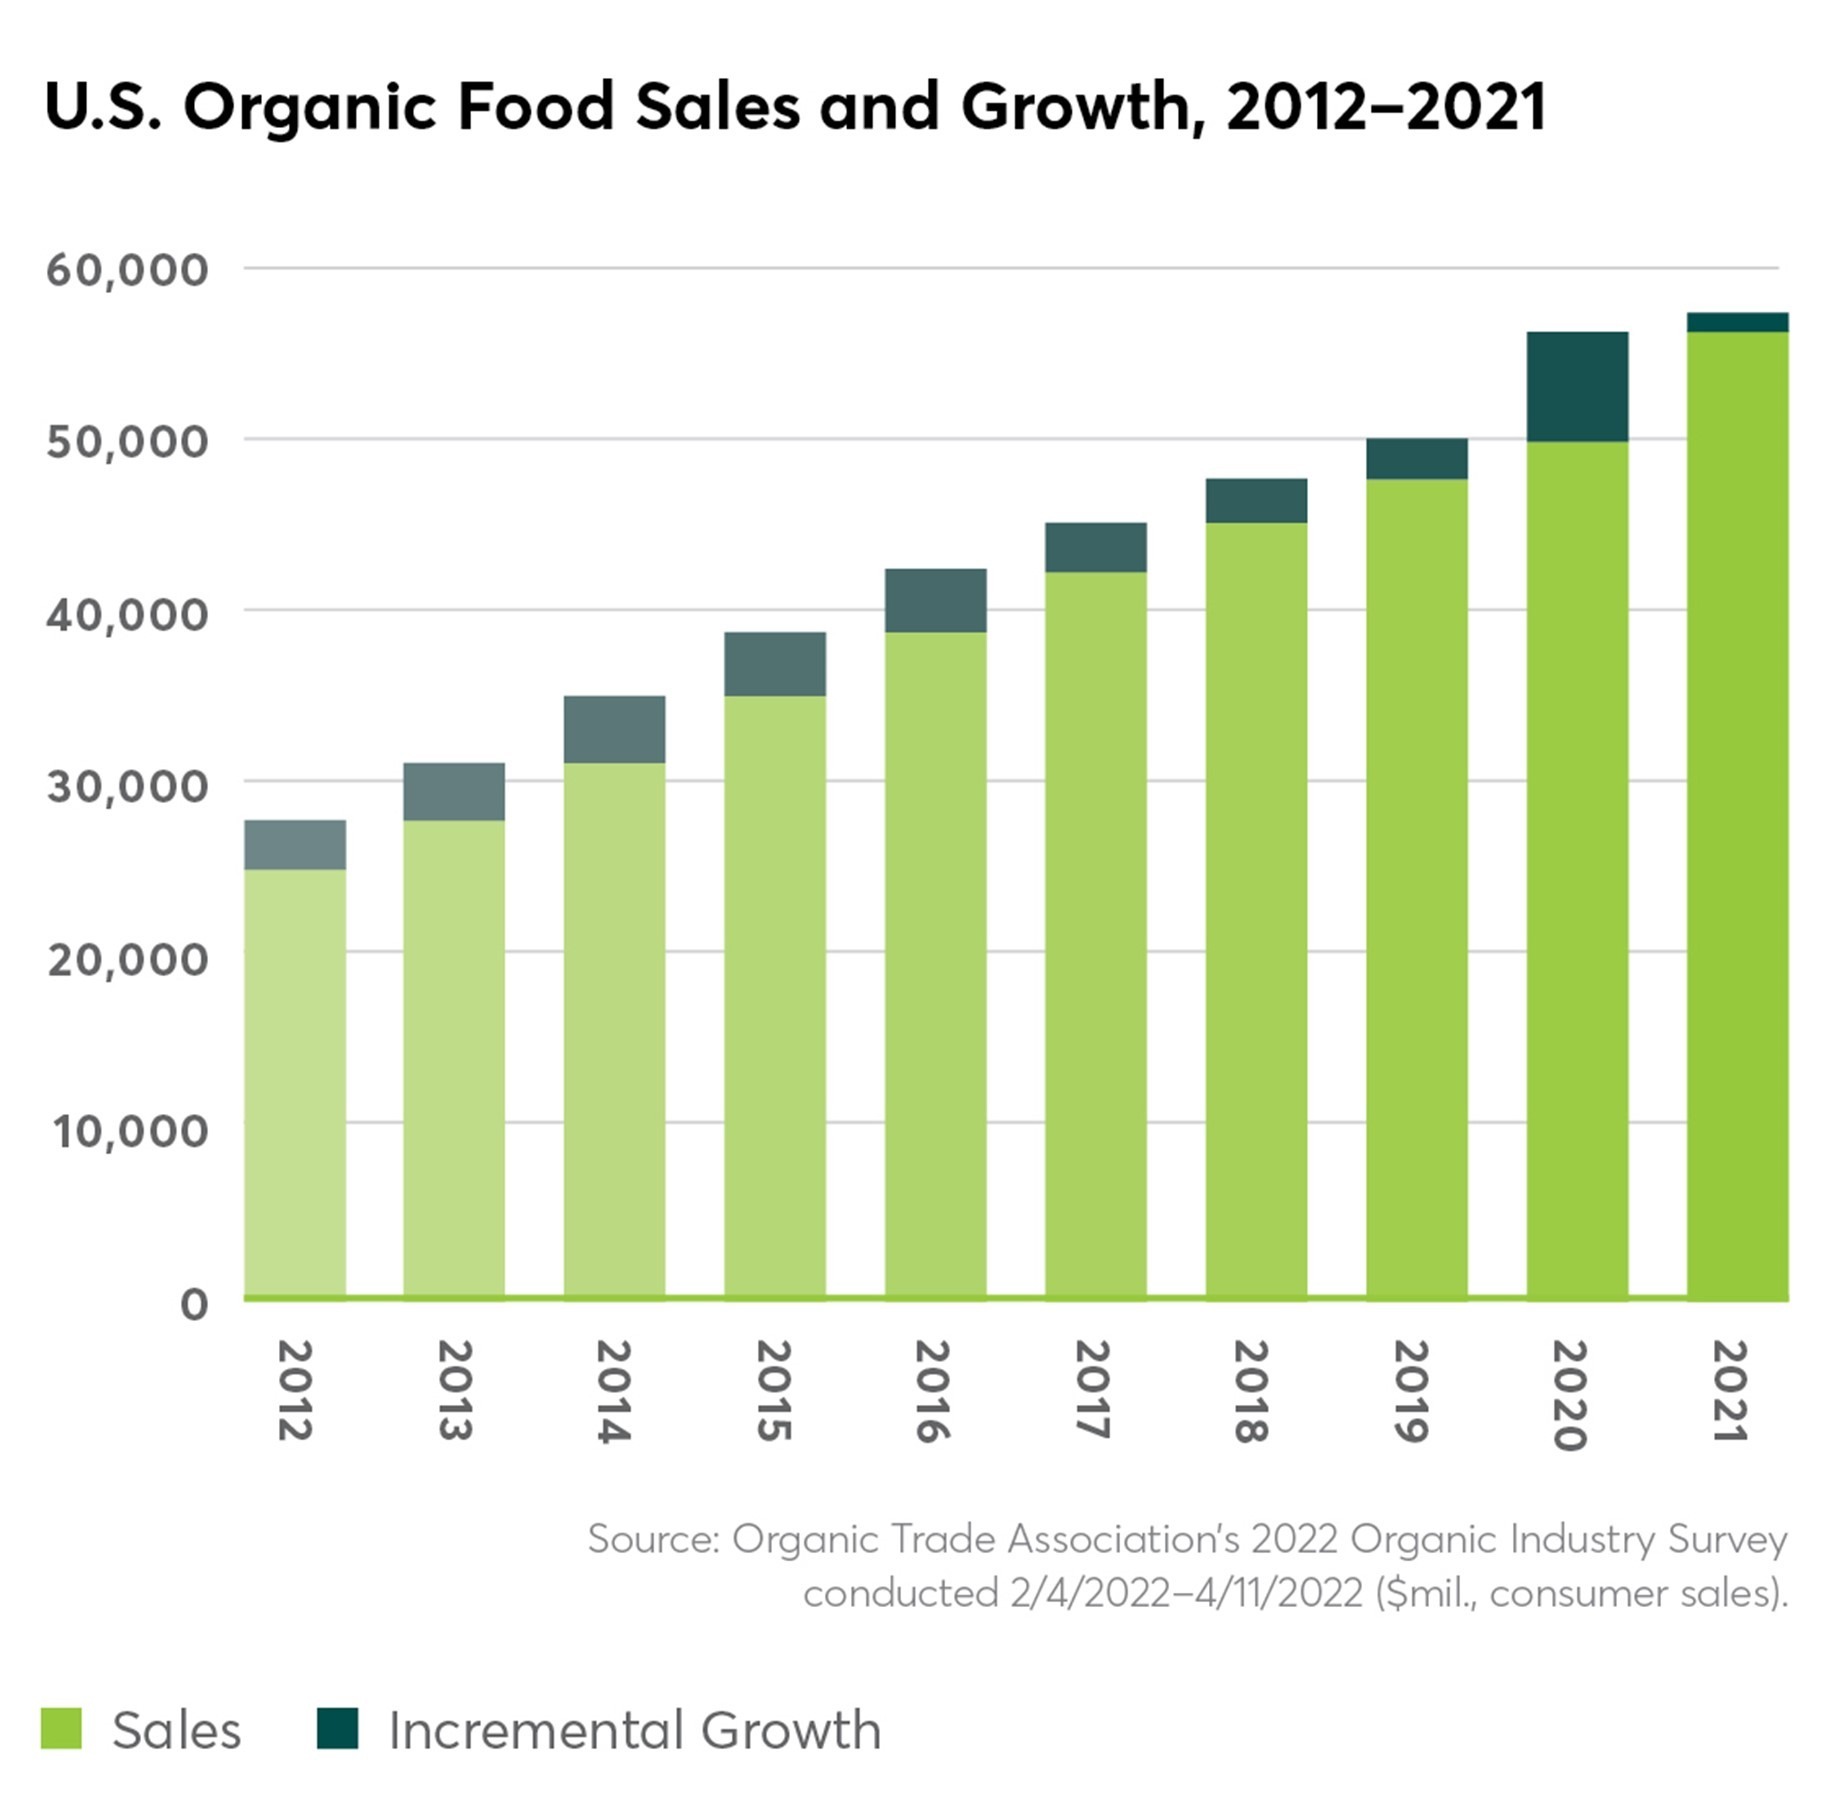
Following an unprecedented year marked by pantry loading and supply shortages, the Organic Trade Association’s (OTA) latest Organic Industry Survey shows consumers returned to more stable, buy-as-you-need shopping patterns in 2022. Between 2020 and 2021, organic sales surpassed $63 billion, with $1.4 billion (2 percent) total growth over the year. Food sales, which comprise over 90 percent of organic sales, rose to $57.5 billion (roughly 2 percent growth), and non-food sales reached $6 billion in sales (7 percent growth).
Fruits & Vegetables
Organic fruits and vegetables accounted for 15 percent of the total product market and brought in over $21 billion in revenue in 2021 – an approximately 4.5 percent increase over 2020. Fresh produce and dried beans, fruits, and vegetables drove growth in the category, showing 6 and 6.5 percent growth over the year, respectively. Frozen and canned foods declined slightly as consumers reduced pantry loading. Packaging on produce has increased since the beginning of the pandemic, as some shoppers perceived that it might better protect food from airborne viruses. It is yet unclear if this trend will continue, however, as organic food shoppers historically have preferred less packaging and plastic use.
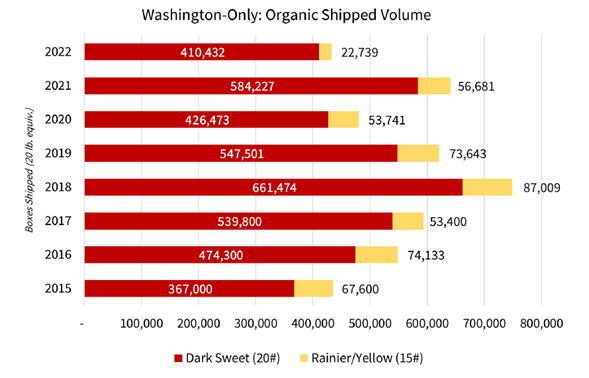
For 2022, the Washington State sweet cherry industry shipped 4,616 tons of organic sweet cherries, down from 4,627 tons in 2021. This statistic alone is impressive as the total Northwest crop was down by 35% in 2022. Likewise, this correlates to 461,600 20 lb. equivalent boxes. Based on the fruit picked in Washington only, organics make up 3.5% of this year’s shipped crop – which was a slight increase from the year before as organics made up 3% of the total crop. As a benchmark, organic production was just over 1% of the total crop as recently as 2009 – which indicates a continued net growth in this important sub-category.
Below is a chart showing organic sweet cherry production in box volume in the state of Washington for the period 2015 to 2022:
Row Size and Quality of the 2022 Crop
The Northwest will never be the low-cost producer of sweet cherries on the world market. However, the Northwest can be the world’s top producer of quality sweet cherries. Based on market demand and consumer preferences; large, sweet cherries drive repeat sales at retail both domestically and in export markets. Larger cherries drive a larger return for growers. Collectively, it is our goal to produce the best sweet cherries in the world and growers have plenty of incentives to farm in a way that produces the largest possible cherries. Row size continues to be an important indicator of quality … and has become a critical standard by which growers measure their production success. Industry post-harvest research points to the fact that larger cherries have a longer shelf life and, on average, have higher sugar levels … which lead to a better eating experience for the consumer. The team at the NWCG hosts numerous educational days for growers and attempts to relay this philosophy to the entire grower base. It is safe to say that “quality” is a key factor in the successful sales and promotion strategy that our industry implements each year. Likewise, the emergence of new technology optical sizing and sorting machinery within the packing facilities has further raised the bar on the “cherry that goes into the box”.
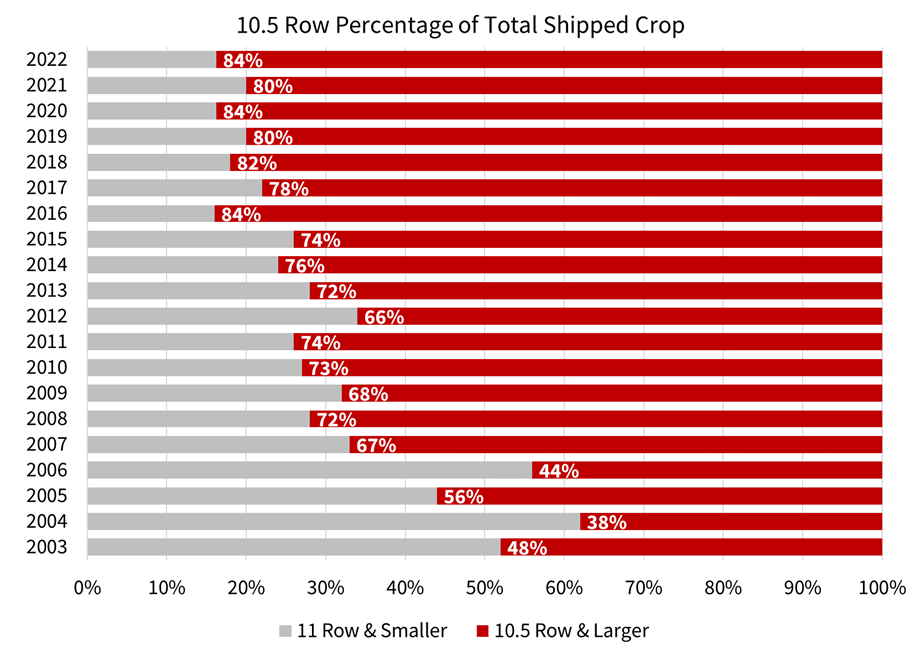
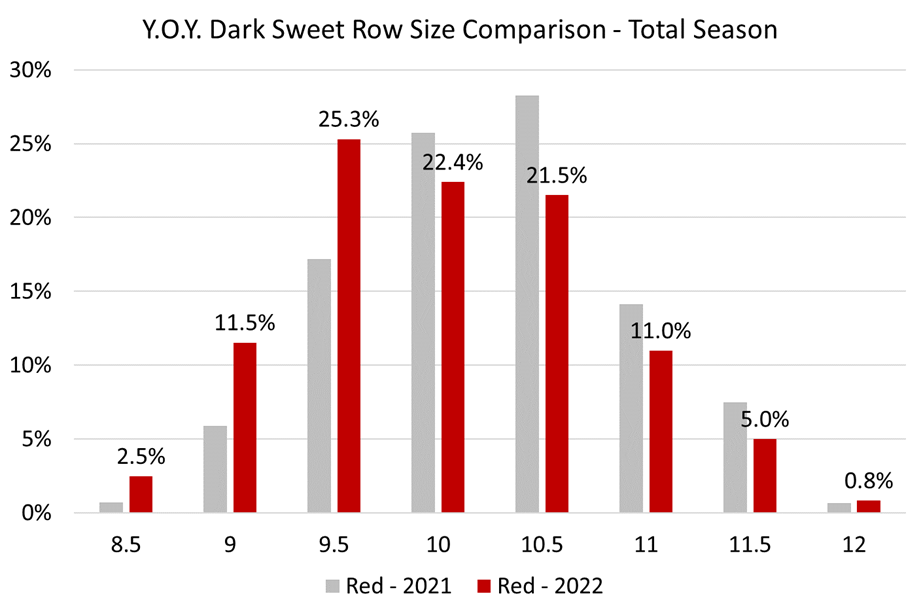
With a shorter than normal crop on the trees the expectation was that Northwest growers would be able to grow some larger cherries in 2022. Despite several rain related events that split some of our larger fruit in the front half of the season, our growers were still able to grow some outstanding sized fruit this past season. In total, 84% of the crop was shipped as 10.5 row and larger – in 2021 the industry shipped 80% of the crop as 10.5 row and larger.
In comparing the 2022 crop with the 2021 crop there were significantly more 8.5, 9, and 9.5 row cherries this past season. In fact, 9.5 row cherries made up a record 25% of the 2022 crop. The adjacent chart shows the extreme jump in prevalence of large size cherries in 2022 vs. 2021:
The Export Markets 2022
The 2022 NW Cherry export market was under stress from the short crop, strong U.S. dollar, COVID, and trade war issues with our largest offshore market: China. Despite these challenges, NWCG programs had a positive effect on demand from the export markets. Despite the loss of the Chinese market to the US-China Trade War, the export markets continue to be a critical piece of how and where the NW cherry crop is sold. In 2022, the NWCG ran promotion programs in 17 countries. Marketing strategies for the export markets continue to focus on creating a regional identity associated with the very best quality cherries found on earth … grown in our unique corner of the United States. NWCG works to associate Northwest cherries with healthy, clean, and environmentally conscious production practices
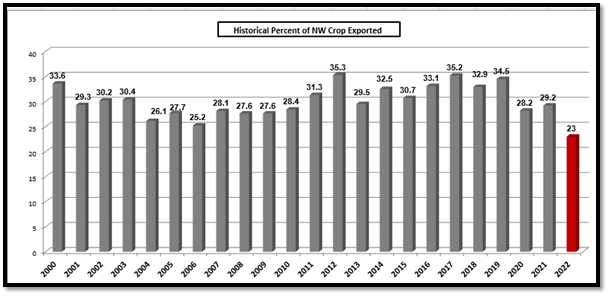
From a marketing standpoint, the industry has found that for the growers to sustain financial success, the export market needs to absorb between 25% and 30% of the annual crop. The chart above shows the percentage of the crop that has been exported since 2000. The 2022 season saw 3.1 million 20 lb. boxes exported. This portion of the crop accounted for 23% of the volume and 23% of the dollar sales in 2022. On a positive note, the Northwest industry shipped its first cherries to India under the systems approach in 2022. There was a total of 3,302 20 lb. equivalent boxes shipped to India this past year. The Indian market has been recipient to two years of “Care and Handling” training sessions with importers and retailers across India.
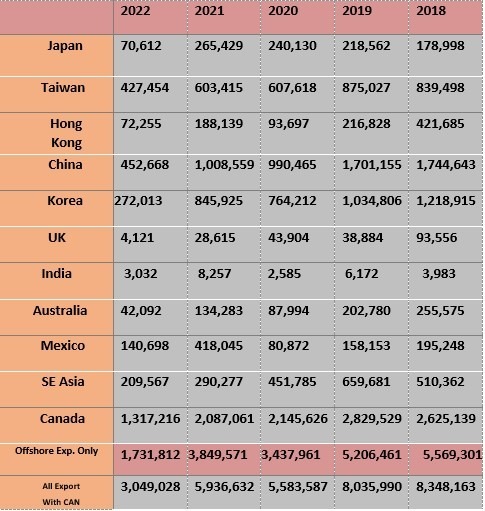
The NWCG international marketing programs are covered more completely later in this report. Adjacent is a five‐year historical look at 20 lb. equivalent boxes to our key promotional program markets:
Northwest Cherries Acreage Overview
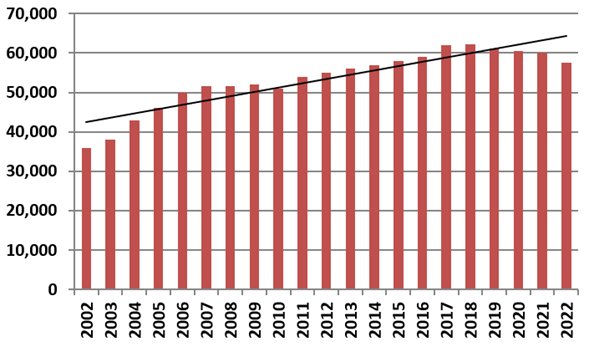
Based on USDA NASS surveys, the state of Washington now has 42,198 acres of sweet cherries planted. Likewise, the average tree density per acre count in Washington is 270 trees per acre. Based on previous surveys in Oregon, Idaho, Montana and Utah, the total acreage for the Northwest is estimated at 61,995 acres. This data is from 2017, and as the last acreage survey was done in 2011, the Northwest crop has increased by 11% during that 5-year window.
Overall, it is estimated that the Northwest has just under 58,000 acres of sweet cherries in production – with new plantings still occurring but the removal of trees and acreage due to “Little Cherry Disease” has served to mitigate overall acreage growth for the Northwest production region. Fresh tonnage for the Northwest has averaged 204,113 over the past five years – which correlates to just over 20 million 20 lb. equivalent boxes per year. In other words, a 20 million box crop is the expectation on any given year despite the fact that forecasting in the cherry business is not an exact science because of the many factors affecting availability each season. The near term (over the next 5 years) forecast is that Northwest crops will continue to range from 200,000 to 250,000 tons of fresh sweet cherries.
Little Cherry Disease in the Northwest Cherry Industry
In the Pacific Northwest, our fresh cherry crop harvest begins in late May or early June. With almost 60,000 acres across 5 states, we are expecting to have a quality crop of fruit for market in 2023. However, the work of growing sweet cherries is a year-round affair and it’s getting longer, thanks to the evident spread of a group of pathogens collectively referred to as Little Cherry Disease. New research from a multi-state task force indicates that beyond tree and/or orchard removal, it’s necessary to control the vectors within orchards for months past harvest, adding additional costs and challenges to already burdened growers. Beyond that, it appears that intervention has removed several million boxes of production capability for the coming season. For several years growers across the Northwest have been feeling the effects of a group of pathogens collectively called Little Cherry Disease (LCD). Though different in nature, this group of viruses and bacteria cause the same results: small, under-developed, and bitter fruit. Researchers have narrowed down their spread between orchards to several insects who carry LCD on their bodies, though the exact method of insect relocation between orchards or spots within an orchard is still yet to be confirmed.
What we do know is that our industry’s orchard practices and packing technology ensure none of the small, bitter fruit is shipped for consumers. The high quality of Northwest cherries is a standard throughout the world, and we are committed to maintaining that bar. Even though it’s been an orchard issue for several years, our shipped crop 5-year average is 80 percent 10.5 row and larger, which is an increase over the 10-year and 15-year averages.
Behind the scenes, it has required some aggressive intervention by our growers. There is no cure yet, so the only procedure to stop the spread is tree or orchard removal. Even after removal, the ground must be attended to and the local source of infection must be addressed, otherwise growers risk re-infecting their replanted orchard. Aside from heavy financial costs, this orchard and tree removal has hit our industry production capability as well. Collectively, our industry estimates that intervention measures have reduced our potential volume by 2.5-3 million boxes for the coming season. The image below shows what infected cherries look like on the tree. Once a grower finds this in the tree, the tree is marked for removal and fewer cherries go to market.
The Pacific Coast Cherry Industry
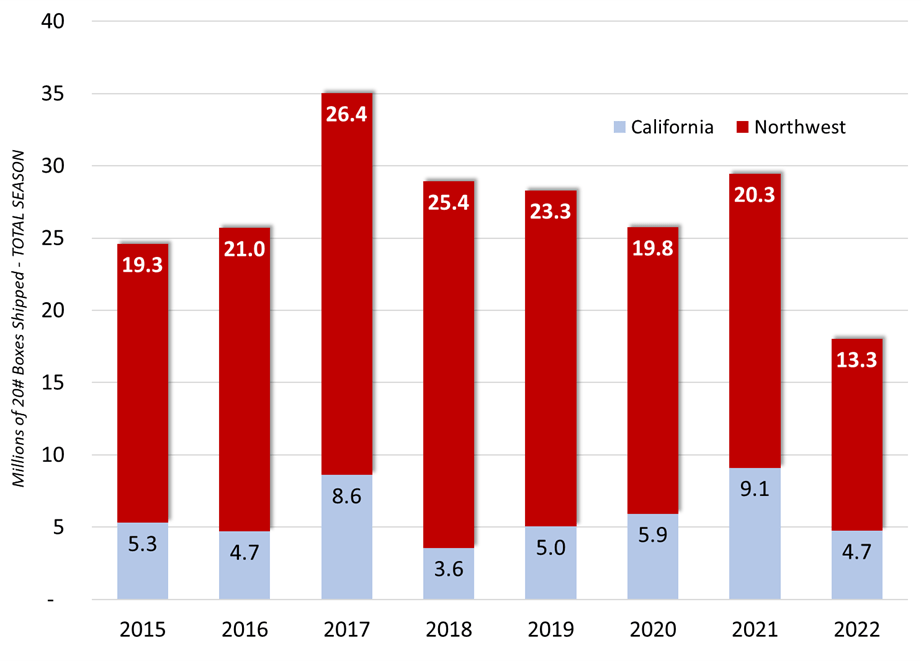
California’s percent of U.S. sweet cherry shipping volume decreased significantly in 2022. The ratio of Northwest volume to California volume was 74% to 26% in 2022. For comparison, in 2021 the Northwest was 69% and California was 31% of the U.S. fresh crop.
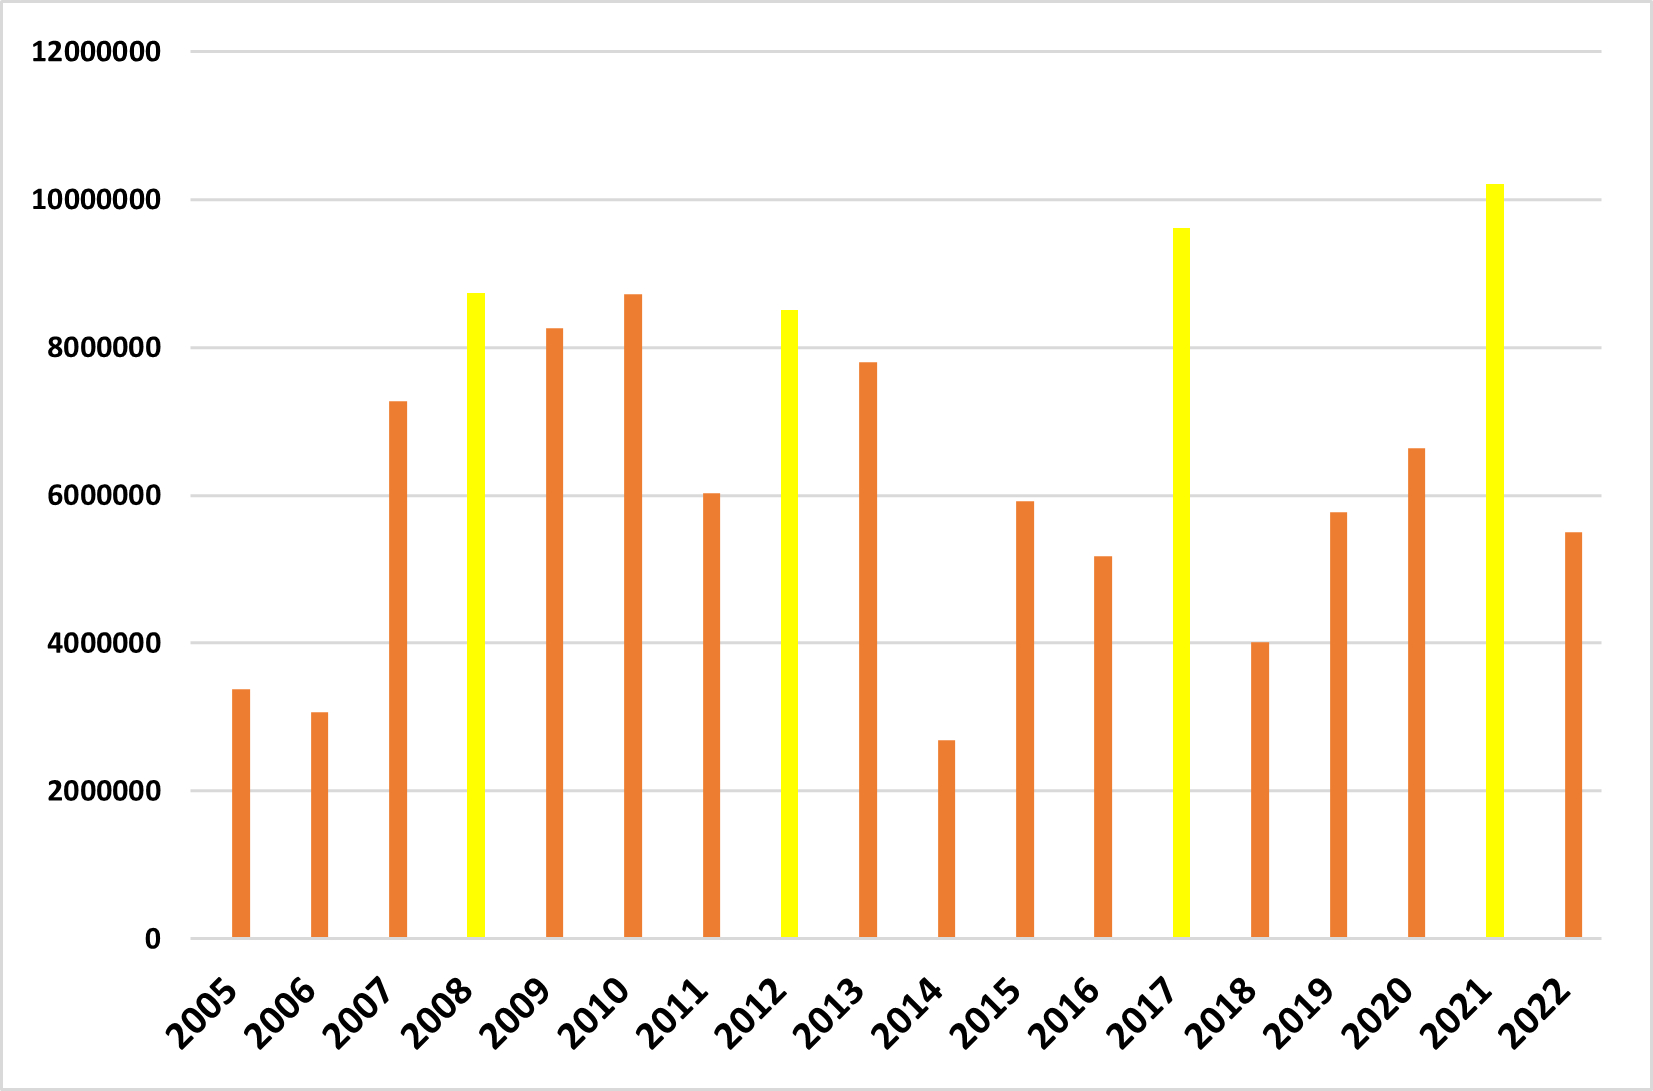
California seems to hit a big crop about every 4 years. Below is a chart showing volume of California crops over the past 17 years – with the yellow years appearing at 4-year intervals:
Current USDA acreage data suggests that the Pacific Coast industry is nearing a total of 100,000 acres of sweet cherries. Like the Northwest, the growers in California also had a cool spring that resulted in a light set crop across all of their growing districts. They shipped a total of 4.7 million 20 lb. equivalent boxes. Combined, California and the Northwest shipped the fewest cherries since 2008. The 2022 Pacific Coast crop came in at a beleaguered 18 million 20 lb. equivalent boxes – a decrease of 39% from the 29.4 million boxes packed in 2021.
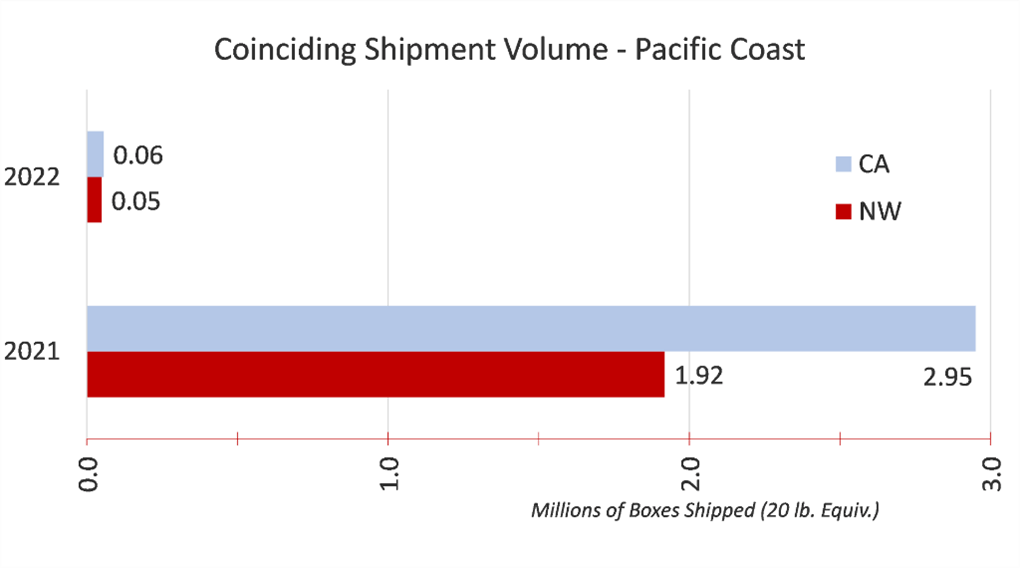
Generally, the overlap between the Northwest and California is a non-issue. It became a major issue in 2021 when the industry overlapped on almost 5 million boxes. The opposite was true in 2022; as the California industry had a short crop that was for the most part finished by early June. For 2022, the Northwest and California shared only 5 days of shipments and a total of 1.1 million boxes shipped in the limited cross-over menu. The chart below shows overlapping shipments between the two production regions over the past two years:
Regardless, both industries work to communicate crop load and timing, which overall has helped in an orderly transition between the end of the California crop and beginning of the Northwest crop. Lastly, the Northwest and California industries have worked together over the past several years to establish open dialogue and shared efforts on numerous fronts including partnering on health-based research surrounding sweet cherries.