
2023 NORTHWEST CHERRY CROP STATISTICAL OVERVIEW
The 2023 Northwest Cherry Season will be remembered as the year the California sweet cherry crop was 3 weeks later than normal and the market was upside down by the time the growers in the Northwest picked their first cherry. California saw the coldest winter and spring in 120 years which resulted in the latest ever for the California cherry growers. The cold winter down south had other negative implications that led to too many cherries available for sale in mid-June through mid-July. Key issues that happened to the California growers included:
- Heavy spring rains did not allow California growers to apply Dormex in their normal effort to push their crop early by 5 to 7 days.
- The late start caused the California industry to miss the Memorial Day holiday for promotions – which led to millions of boxes backing up on California cherry packer floors in early June.
- Retail prices in June stayed above $5 per pound which did not inspire consumers to purchase cherries in volumes required to move the CA crop.

Northwest growers did not begin harvest until mid-June but almost half the California crop still needed to be sold – which resulted in an over-supply to the market in June and July. The final crop volume number for 2023 was 18,742,834 20 lb. equivalent boxes. Overall, the quality of the fruit produced by Northwest growers in 2023 was outstanding and both consumers, retailers and importers stated that fruit quality was stellar.

The peak shipping day in 2023 was July 5th – where 577,493 boxes were shipped. It is important to note that historically, the industry’s largest shipping days usually fall between 600,000 and 700,000 boxes. The Northwest industry shipped 5.4 million boxes in June, 11.6 million boxes in July, and 1.75 million boxes in August. The domestic market absorbed 67% of the fruit and the export markets took in 33% of all cherries shipped in 2023.
Adjacent is a chart that shows both Northwest and California shipments by day in 2021 and 2023:
2023 Northwest Cherry Season Key Statistics:
- The industry shipped for 84 days in 2023. The first shipments left the industry on June 9th (greenhouse cherries – but most of the industry didn’t get going until June 14th) and the last box shipped on September 1st. In comparison, we shipped for 93 days in 2022, 92 days in 2021, 94 days in 2020, 90 days in 2019 and 2018, 86 days in 2017, and 87 days in 2016.
- As always, the brunt of the crop was shipped in 60 days from mid-June to mid-August.
- The industry shipped 5.4 million 20 lb. boxes in June.
- The industry shipped 11.5 million boxes in July 2023.
- On July 5th, the industry shipped 577,493 boxes which was the 2023 peak shipping day.
- The second largest shipment day was July 7th – 543,696
- The industry averaged 434,209 boxes per day from June 20th to July 20th. Comparatively, we averaged 356,083 boxes per day from June 20th to July 20th in 2021.
- The industry averaged 155,075 boxes per day during the 84 days of the 2023 season.
- The Rainier cherry pack was 1.55 million 15 lb. equivalent boxes.
- The crop shipped was 67% domestic and 33% export in 2023.
- California started shipping cherries on April 29th (latest start ever) and finished shipping on July 25th. In total, CA shipped a crop of 11 million 18 lb. equivalent boxes in 2023. The California sweet cherry industry and the Northwest overlapped for 50 days in 2023.
- There were 5 million boxes of overlap shipments between both the NW and CA in 2023.
Bloom Timing: Northwest is hit by snow on top of bloom in mid-April 2022
The best thing we can say about 2023 spring weather is good-bye La Niña and hello El Niño. It took until July for La Niña to finally relinquish her hold on Northwest weather patterns over the past three years … but the hope is that the new El Niño weather pattern will bring more stable weather conditions than the high heat and extreme cold the La Niña weather pattern did over the past three years.
The degree day development for 2023 started out slowly building and then gained momentum in mid-April when temperatures jumped from the 60’s to the mid-90’s. The warm trend stayed in place through the summer and ended pushing late growers early … while early and mid-season growers remained late. This led to heavy compression on the crop in late June and early July.
The bloom for 2023 ended up being significantly compressed when we saw trees blooming in Yakima and Chelan at the same time. This led to heavy overlap amongst districts in 2023. In fact, the late California crop, the Northwest crop and the Canadian crop all intersected in shipments in late June and through most of July.
The bloom chart below shows how late and compressed the 2023 bloom was. Years when mid and late season fruit bloom at the same time generally leads to a market where at some point there is more fruit available than the market can successfully absorb.


1999 to 2023 Historical June Shipments in Millions of Boxes
Adjacent is a chart showing the past 25 years of June shipments. As you can see, the industry shipped over 5 million boxes in June – this is a significant amount of fruit – that most of that volume shipped after June 15th. The first recorded shipments left the industry on June 8th. The California crop shipped until into late July.

2023 July Compression Leads to Challenging Market
The beginning of July we saw the Northwest harvest ramp up quickly as our mid-season was several days behind normal and many later orchards saw their harvest timing move forward by several days. Unfortunately for all NW growers, this phenomenon resulted in a huge influx of available cherries at a time where tired and aged California cherries were sitting on store shelves in abundance. Likewise, the 30-day window between June 20th and July 20th saw a record amount of fruit available and shipped in that window. Between the Northwest, California, and Canada we saw the availability of at least 21 million 20 lb. boxes in the window depicted below. The most fruit the Northwest has ever shipped in a 30 day window was 16.5 million boxes which occurred in 2017.
During the July window, the biggest fresh sweet cherry holiday of the year … the 4th of July saw over 50% of domestic shelf space allocated to California cherries; this scenario also had a broad negative affect on downward market price trends during the mid-June to mid-July window.

As we have seen regularly over the past decade, July was our single largest shipping month in 2023. As the adjacent chart depicts, we saw 11.5 million 20 lb. equivalent boxes shipped in July this year.

To successfully get through July, the industry needs to have a mix of quality fruit, consumer demand, and momentum carried over from June fruit sales. The lowest promoted prices of the year occurred during the last week of July. The domestic market showed promotional retails that hovered around $3. Based on 2023 Northwest Cherry Grower domestic promotional strategy … ad programs were targeted in March for the month of July. Despite a challenging market through the first several weeks of July, ad pricing dropped, and ad activity increased in the second half of July … to the point where the market began to clear, and growers were able to see reasonable returns in late July and early August.
August: Late Orchards Enjoy an Improved Market

In 2023, the warm weather that began in mid-April stayed with us throughout the summer. As a result, the crop (especially the late crop) moved forward and limited the available supply in August. This year the Northwest industry shipped 1.8 million 20 lb. equivalent boxes in August. Again, the last shipments left the industry on September 1st. Likewise, it remains relevant to note that the industry consistently shipped almost 4 million boxes after July 25th during the years 2011 to 2012. Likewise, this phenomenon remains an annual opportunity for retailers and importers to maximize sweet cherry category sales almost to September.
Late maturing varieties continue to see acreage expand throughout the Northwest region. Currently, there is an abundance of high density/high elevation plantings of late harvest varieties like Sweetheart, Glory, and Staccato that allow for shipments to last into September.
The Varieties: Skeena Becomes the Number One Cherry Shipped by Volume in 2023
As always, our industry certificates of compliance were heavy to “dark sweets” in 2023. The variety designation “dark sweets” accounted for over 50% of the crop. Each year, more retailers are requesting a box label/stamp that simply states “dark sweets” or “sweet cherries” with no mention of specific variety. For only the second time, the Bing variety is not the single largest variety by volume. We have lost Bing volume to both little cherry disease and growers planting varieties that have potential for more tonnage per acre than Bing traditionally offers. This year the Northwest picked and packed 1,640,735 boxes of Bings which made up 8% of the 2023 crop.
This year the variety Skeena ended up being the largest variety by volume; the industry shipped 2,016,459 boxes – which constituted 10% of the entire crop. This year the Northwest industry shipped 796,043 boxes of Sweethearts (3.8% of the crop) which was the third most prevalent variety. Of note, a couple of varieties jumped in volume this past year. Newer varieties like Coral Champagne and Black Pearl emerged as the varieties that saw the most volume growth in 2023.
For an overall look at volume by variety over the last 5 years, please refer to the adjacent Volume by Variety chart:
Total Boxes Shipped by Variety ~ Reported in 20 lb. Equivalents

Yellow Variety Cherry Update
The yellow cherry crop came in shorter than hoped in 2023. This year’s Rainier or yellow cherry harvest produced a crop which came in at 1.55 million 15 lb. equivalent boxes. This volume constitutes 6.4% of the total crop. Yellow cherries accounted for 14% of all cherries exported in 2023. Leading export markets in terms of volume were Canada, China, Taiwan, and Japan respectively.
The yellow cherry crop saw reasonable demand from the beginning to the end of the season. Below is a chart that shows how the yellow cherry crop shipped in 15 lb. equivalents over the last decade. As mentioned, the shorter expected yellow cherry crop was down from the 2018 record crop of 2.55 million 15 lb. boxes by 40% … which serves as a reminder that there remains excellent opportunity to promote the yellow cherry category in the future.
The yellow cherry crop saw reasonable demand from beginning to end of the season. On the right is a chart that shows how the yellow cherry crop shipped in 15 lb. equivalents over the last decade. Despite the short crop in 2022, the industry increased its Rainier volume by 185% during that time.
The chart below depicts shipments of yellow varieties in the 2022 crop compared to 2021 and the 5‐year average.
If you are a retailer, it is important to note that there is an important trend occurring in what is a new “early” variety of Rainier. This variety is called the “Early Robin” and while it is indiscernible from a traditional Rainier, it is picked a full week ahead of the traditional Rainier variety and has almost identical qualities.
The chart below depicts shipments of yellow varieties in the 2023 crop compared to the 5‐year average.


If you are a retailer, it is important to note that there is an important trend occurring in what is a new “early” variety of Rainier. This variety is called the “Early Robin” and while it is indiscernible from a traditional Rainier, it is picked a full week ahead of the traditional Rainier variety and has almost identical qualities.
Organic Sweet Cherry Production in Washington State
For the tree fruit industry and sweet cherries, the organic sector will continue to be a key piece of our future business. Organic food sales in the United States in 2023 broke through $60 billion for the first time, hitting another high-level mark for the resilient organic sector. Total organic sales – including organic non-food products – were a record $67.6 billion*, according to the 2023 Organic Industry Survey.
The organic market grew despite challenging headwinds: inflation pressures tightening consumer wallets, supply chain disruptions caused by the pandemic and global political events, a proliferation of competing food labels in the grocery aisles, and a labor shortage felt acutely by organic producers. Inflation heated up costs across the organic supply chain – indeed, the entire food supply chain – and boosted prices in the grocery aisles. As a result, the organic sector reflected the overall food sector, with the value of organic sales rising even as the growth in the volume of sales for some categories slipped.
The sector’s 4% growth in sales value was nearly twice the pace of growth in 2021. Organic food sales totaled $61.7 billion, while the value of organic non-food sales hit nearly $6 billion. Certified Organic now accounts for 6% of total food sales in the United States.

Organic Produce: Fruits & Vegetables
Organic produce, often the entry point for new organic buyers, easily held its position as the top seller of all organic categories. Sales of organic produce totaled $22 billion, accounting for 15% of all fruit and vegetable sales in this country.
Organic beverages were the second best-selling organic category, reporting $9 billion in sales in 2023, up 4%. Organic coffee maintained its position as the biggest-selling organic beverage, up almost 7% from the year before, with close to $2.3 billion in sales. Organic soft drinks and enhanced drinks broke through $500 million in sales at $503 million and saw robust growth of almost 14%.
The third highest-selling organic category was dairy and eggs at $7.9 billion, up over 7% from the previous year. Organic dairy and eggs now constitute close to 8% of the total dairy and egg market. Continued demand and inflationary price increases helped boost the dollar sales in that category; yogurt and eggs both saw double-digit growth, with organic yogurt sales jumping by over 12% to $1.5 billion, and organic egg sales by 11% to around $1.2 billion.
While the growth pace of organic sales has predictably slowed from the barnburner rates during the pandemic, a wide and diverse smattering of organic products showed outstanding growth as consumers bring organic more fully into their lives. To name a few: organic baby food and formula sales up almost 13% to $1.4 billion, sales of organic rice, grains and potato products up over 10% to $387 million, organic dip sales up a big 18% to $194 million, and sales of organic pork up more than 10% to $63 million.
For 2023, the Washington State sweet cherry industry shipped 3,583 tons of organic sweet cherries, down from 4,616 tons in 2022. Likewise, this correlates to 358,175 20 lb. equivalent boxes. Based on the fruit picked in Washington only, organics make up 1.9% of this year’s shipped crop – which was equal to the percentage of organic to total crop in 2022. As a benchmark, organic production was just over 1% of the total crop as recently as 2009 – which indicates a continued net growth in this important sub-category.
Below is a chart showing organic sweet cherry production in box volume in the state of Washington for the period 2015 to 2023:

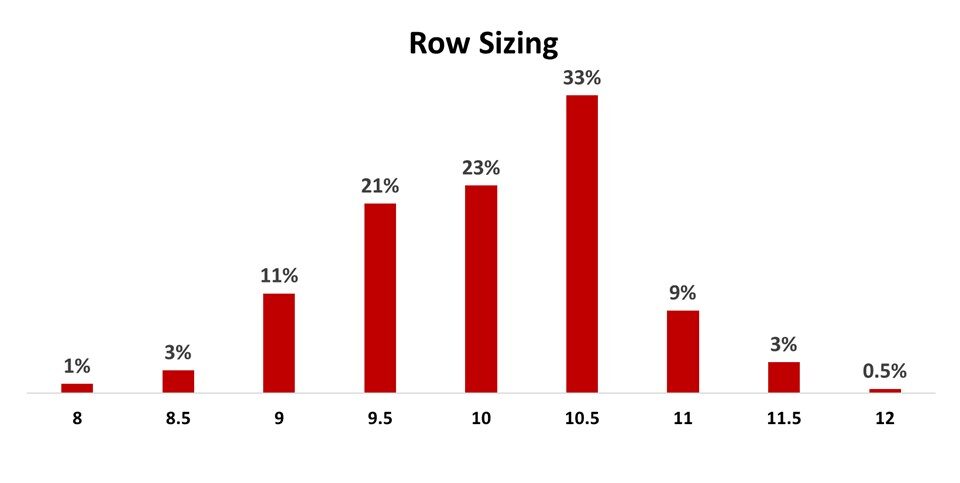
Row Size and Quality of the 2023 Crop
The Northwest will never be the low-cost producer of sweet cherries on the world market. However, the Northwest can be the world’s top producer of quality sweet cherries. Based on market demand and consumer preferences; large, sweet cherries drive repeat sales at retail both domestically and in export markets. Larger cherries drive a larger return for growers. Collectively, it is our goal to produce the best sweet cherries in the world and growers have plenty of incentives to farm in a way that produces the largest possible cherries. Row size continues to be an important indicator of quality … and has become a critical standard by which growers measure their production success. Industry post-harvest research points to the fact that larger cherries have a longer shelf life and, on average, have higher sugar levels … which lead to a better eating experience for the consumer. The team at the NWCG hosts numerous educational days for growers and attempts to relay this philosophy to the entire grower base. It is safe to say that “quality” is a key factor in the successful sales and promotion strategy that our industry implements each year. Likewise, the emergence of new technology optical sizing and sorting machinery within the packing facilities has further raised the bar on the “cherry that goes into the box”.
In short, for the most part – Northwest growers grew outstanding cherries in 2023. By the time the Northwest harvest began, the market was down to taking 11 row and larger fruit. The 2023 crop was made up of 87% 10 ½ row and larger cherries. Conversely, the percentage of fruit that was 11 row and smaller was a mere 13% of the crop. The adjacent chart shows row size by percentage of total crop:
The Export Markets 2023
The 2023 NW Cherry export market was coming off of a short crop year where fewer cherries were exported in 2022. This scenario was less than optimal coming into an important 2023 export season. Likewise, there continues to be trade war issues with our largest offshore market: China – along with MRL and access issues with other NWCG key markets of Korea and Taiwan. Despite these challenges, NWCG programs had a positive effect on demand from the export markets. Despite the loss of the Chinese market to the US-China Trade War, the export markets continue to be a critical piece of how and where the NW cherry crop is sold. In 2023, the NWCG ran promotion programs in 17 countries. Marketing strategies for the export markets continue to focus on creating a regional identity associated with the very best quality cherries found on earth … grown in our unique corner of the United States. NWCG works to associate Northwest cherries with healthy, clean, and environmentally conscious production practices.
From a marketing standpoint, the industry has found that for the growers to sustain financial success, the export market needs to absorb between 25% and 30% of the annual crop. The chart above shows the percentage of the crop that has been exported since 2000. The 2023 season saw 6.1 million 20 lb. boxes exported. This portion of the crop accounted for an outstanding total of 33% of the volume and 34% of the dollar sales in 2023. On a positive note, the Northwest industry shipped its first cherries to India under the systems approach in 2022. There was a total of 9,406 20 lb. equivalent boxes shipped to India this past year. The Indian market has been recipient to three years of “Care and Handling” training sessions with importers and retailers across India.
The NWCG international marketing programs are covered more completely later in this annual report. Adjacent is a 5‐year historical look at 20 lb. equivalent boxes to our key promotional program markets:


Northwest Cherries Acreage Overview

Based on USDA NASS surveys, the state of Washington now has 42,198 acres of sweet cherries planted. Likewise, the average tree density per acre count in Washington is 270 trees per acre. Based on previous surveys in Oregon, Idaho, Montana and Utah, the total acreage for the Northwest is estimated at 61,995 acres. This data is from 2017, and as the last acreage survey was done in 2011, the Northwest crop has increased by 11% during that 5-year window.
Overall, it is estimated that the Northwest has just under 58,000 acres of sweet cherries in production – with new plantings still occurring but the removal of trees and acreage due to “Little Cherry Disease” has served to mitigate overall acreage growth for the Northwest production region. Fresh tonnage for the Northwest has averaged 204,113 over the past five years – which correlates to just over 20 million 20 lb. equivalent boxes per year. In other words, a 20 million box crop is the expectation on any given year despite the fact that forecasting in the cherry business is not an exact science because of the many factors affecting availability each season. The near term (over the next 5 years) forecast is that Northwest crops will continue to range from 200,000 to 250,000 tons of fresh sweet cherries
Little Cherry Disease in the Northwest Cherry Industry
In the Pacific Northwest, our fresh cherry crop harvest begins in late May or early June. With almost 60,000 acres across 5 states, we are expecting to have a quality crop of fruit for market in 2024. However, the work of growing sweet cherries is a year-round affair and it’s getting longer, thanks to the evident spread of a group of pathogens collectively referred to as Little Cherry Disease. New research from a multi-state task force indicates that beyond tree and/or orchard removal, it’s necessary to control the vectors within orchards for months past harvest, adding additional costs and challenges to already burdened growers. Beyond that, it appears that intervention has removed several million boxes of production capability for the coming season. For several years growers across the Northwest have been feeling the effects of a group of pathogens collectively called Little Cherry Disease (LCD). Though different in nature, this group of viruses and bacteria cause the same results: small, under-developed, and bitter fruit. Researchers have narrowed down their spread between orchards to several insects who carry LCD on their bodies, though the exact method of insect relocation between orchards or spots within an orchard is still yet to be confirmed.
What we do know is that our industry’s orchard practices and packing technology ensure none of the small, bitter fruit is shipped for consumers. The high quality of Northwest cherries is a standard throughout the world, and we are committed to maintaining that bar. Even though it’s been an orchard issue for several years, our shipped crop 5-year average is 80% 10.5 row and larger, which is an increase over the 10-year and 15-year averages.
Behind the scenes, it has required some aggressive intervention by our growers. There is no cure yet, so the only procedure to stop the spread is tree or orchard removal. Even after removal, the ground must be attended to and the local source of infection must be addressed, otherwise growers risk re-infecting their replanted orchard. Aside from heavy financial costs, this orchard and tree removal has hit our industry production capability as well. Collectively, our industry estimates that intervention measures have reduced our potential volume by 2.5-3 million boxes for the coming season. The image below shows what infected cherries look like on the tree. Once a grower finds this in the tree, the tree is marked for removal and fewer cherries go to market.
The Pacific Coast Cherry Industry

Current USDA acreage data suggests that the Pacific Coast industry is nearing a total of 100,000 acres of sweet cherries. Like the Northwest, the growers in California also had a cool spring that resulted in a light set crop across all of their growing districts. They shipped a total of 9.4 million 20 lb. equivalent boxes. Combined, California and the Northwest shipped the fewest cherries since 2008. The 2023 Pacific Coast crop came in at a robust 28.1 million 20 lb. equivalent boxes – an increase of 54% from the 18.2 million boxes packed in 2023.
Generally, the overlap between the Northwest and California is a non-issue. It became a major issue in 2023 when the industry overlapped on almost 15 million boxes (5 million from CA and 10 million from the Northwest). The chart below shows overlapping shipments between the two production regions over the past five years:
Regardless, both industries work to communicate crop load and timing, which overall has helped in an orderly transition between the end of the California crop and beginning of the Northwest crop. Lastly, the Northwest and California industries have worked together over the past several years to establish open dialogue and shared efforts on numerous fronts including partnering on health-based research surrounding sweet cherries.
Lastly, growers and shippers from the Northwest and California met in Portland, Oregon on February 27, 2024. The purpose of the meeting was to jointly review:
- 2023 Season Review
- Retail Trends
- Importer Trends
- Consumer Trends
- Quality Control and Packing Standards
- Pacific Coast Industry Crop Data and Communication
- Health Research Update and Discussion
Outcomes included a joint agreement by both industries to share pre-season and in-season crop data. Likewise, both growers and shippers agreed that partnering on health messaging was a priority moving forward.